

Real-time pressure mapping
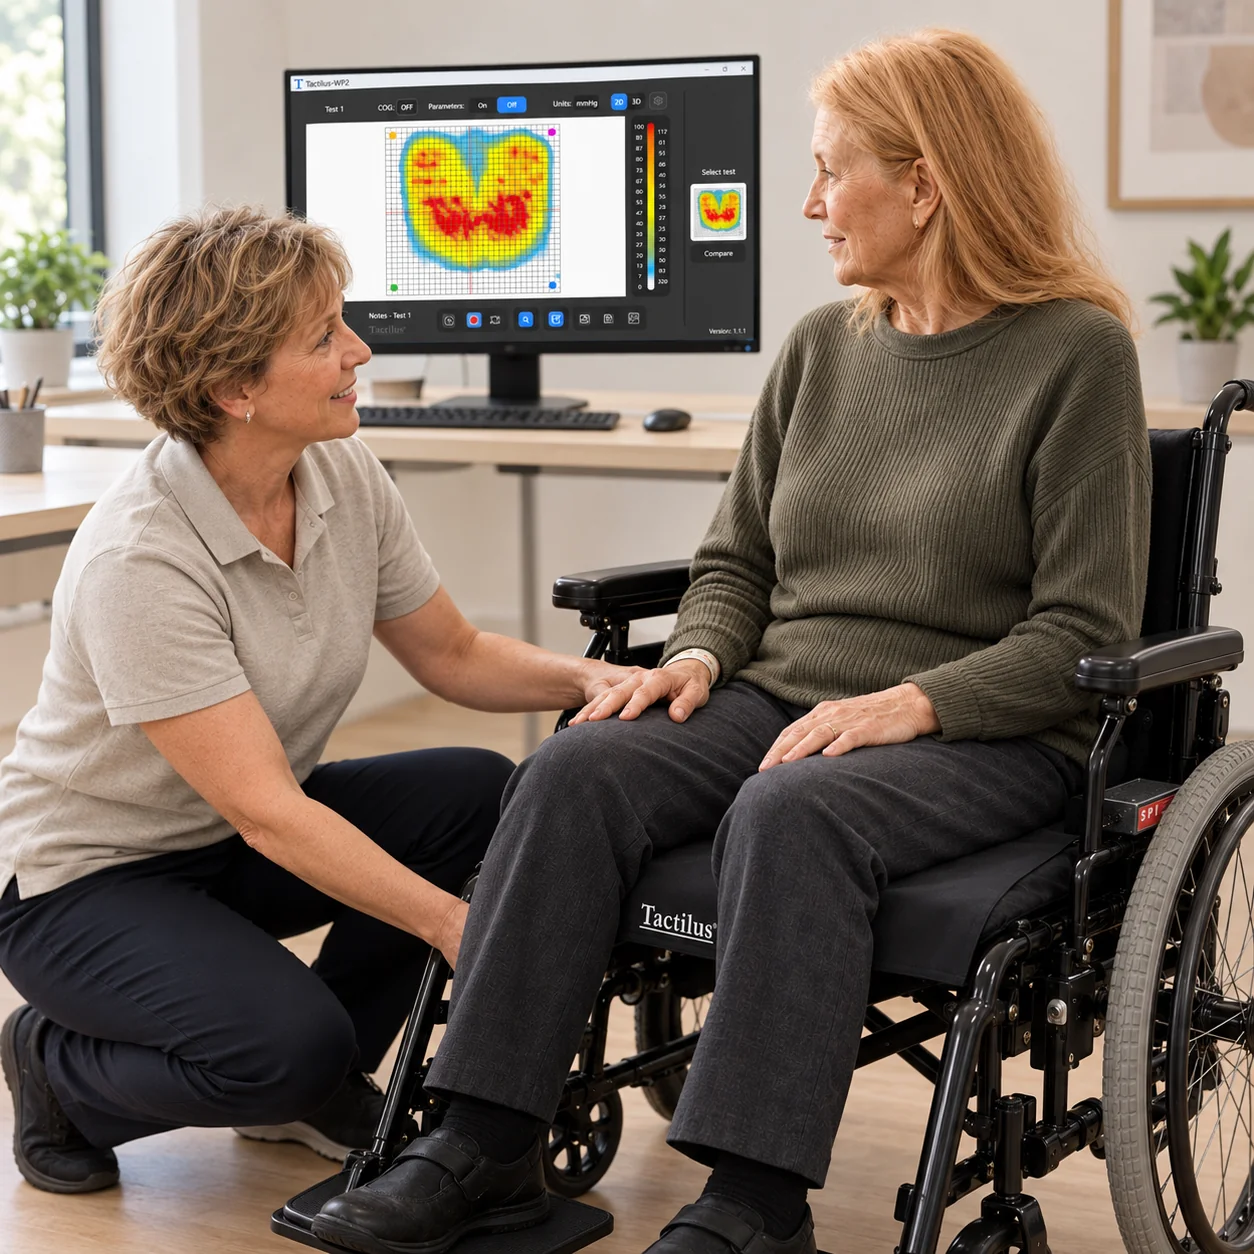
Tactilus records and interprets both the distribution and magnitude of pressure between contacting surfaces, providing a visual representation of how pressure is distributed across the measured area.
Makes pressure distribution easier to understand
Real-time visualisation gives clinicians a clearer view of where pressure is concentrated across the seating surface, helping identify areas that may require closer assessment.
Helps compare different seating solutions
Pressure data can be used to compare different cushions, seating configurations and positioning changes, providing additional information when evaluating which solution performs best for the individual.
Detailed pressure visualisation
The Tactilus software supports 2D, 3D and 360° image rendering, allowing captured pressure data to be examined visually using a range of display and analysis options.
Assess the effect of positioning changes
Clinicians can observe how changes in pressure distribution reflect changes in posture, positioning and seating set-up, helping demonstrate the impact of adjustments during an assessment.
Adds objective data to clinical assessment
Pressure mapping complements clinical observation by providing measurable data that can support and inform the wider seating assessment process.
Easy to set up, use and look after
Tactilus is not only simple to use, but also lightweight and easy to clean down after use.
Thin, adaptable sensor technology
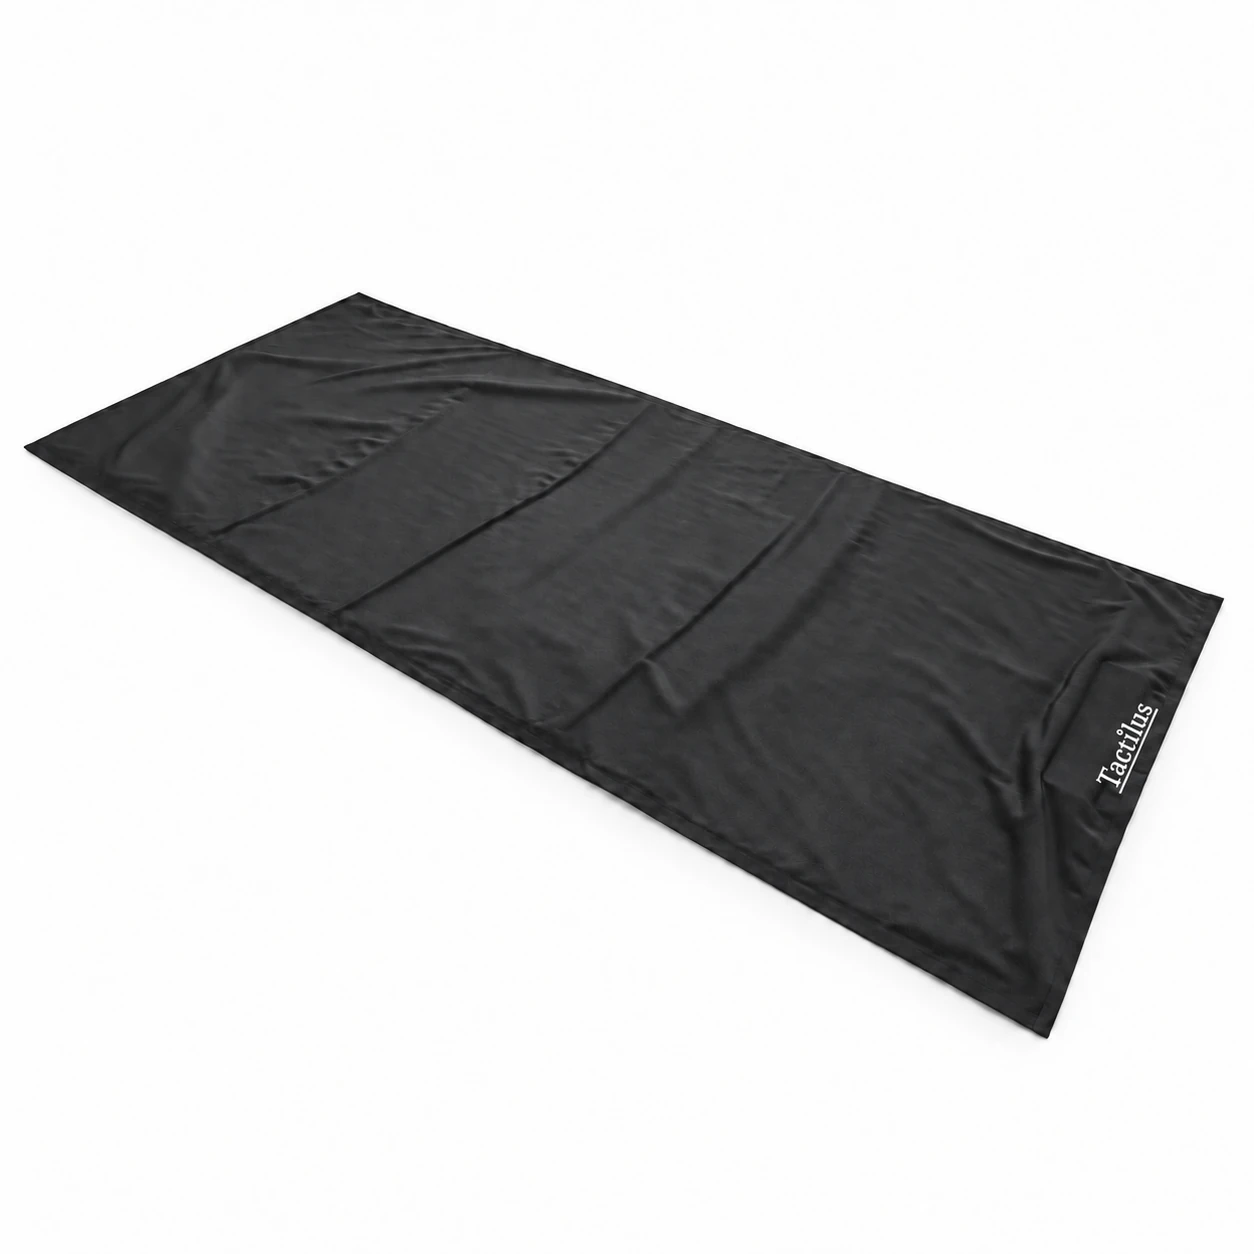
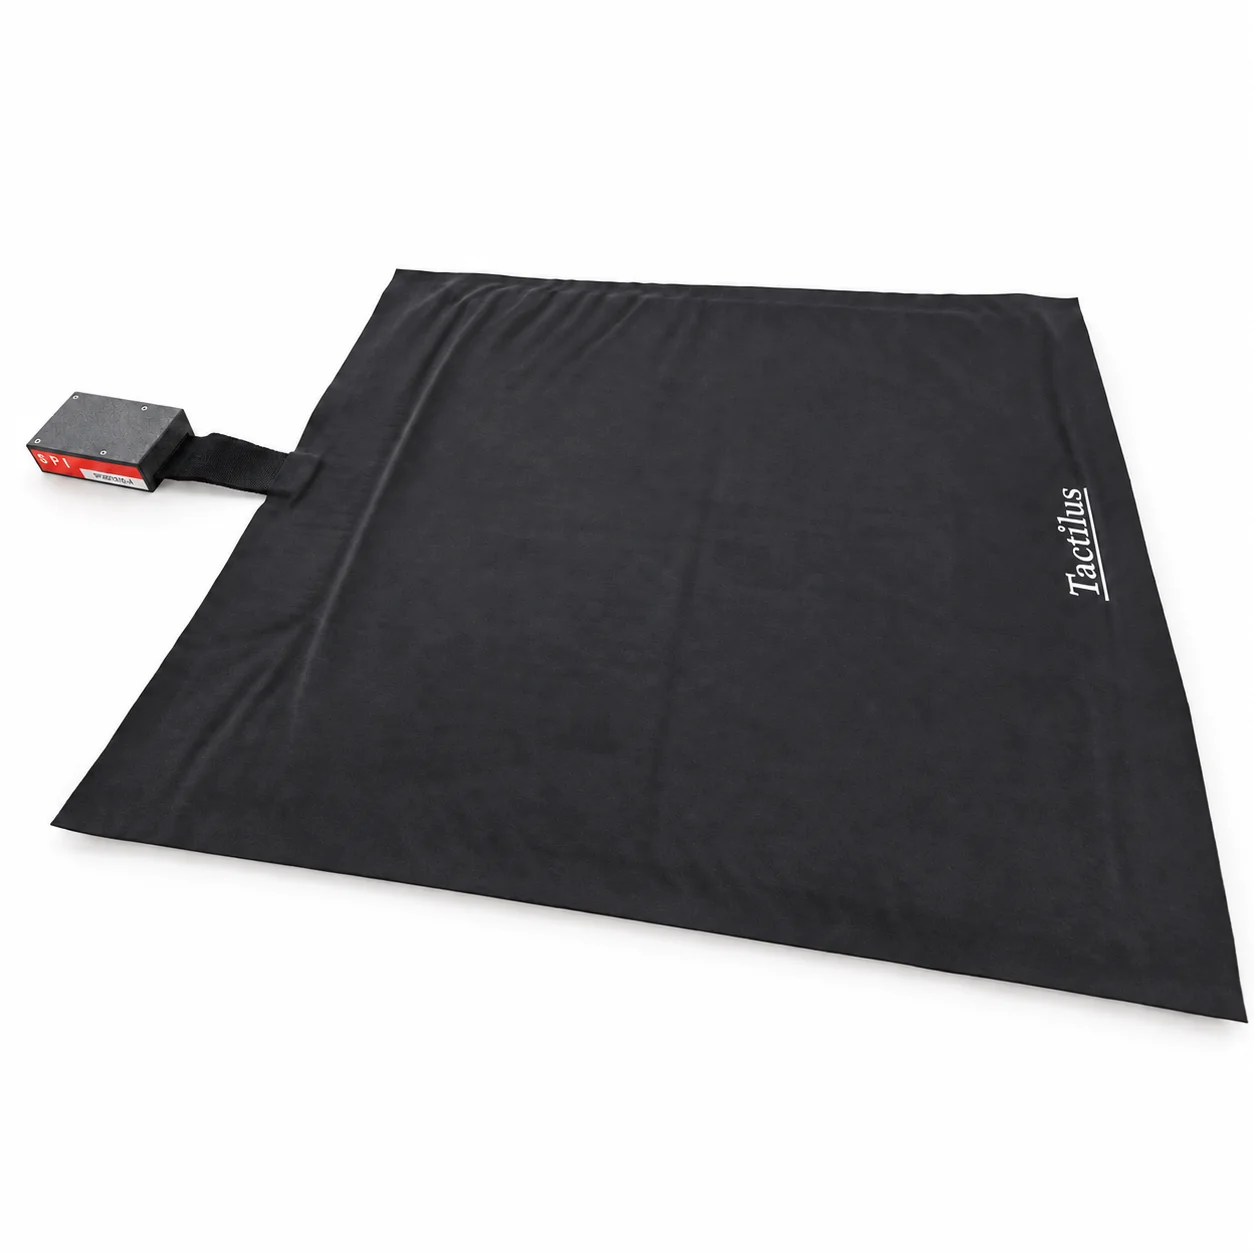
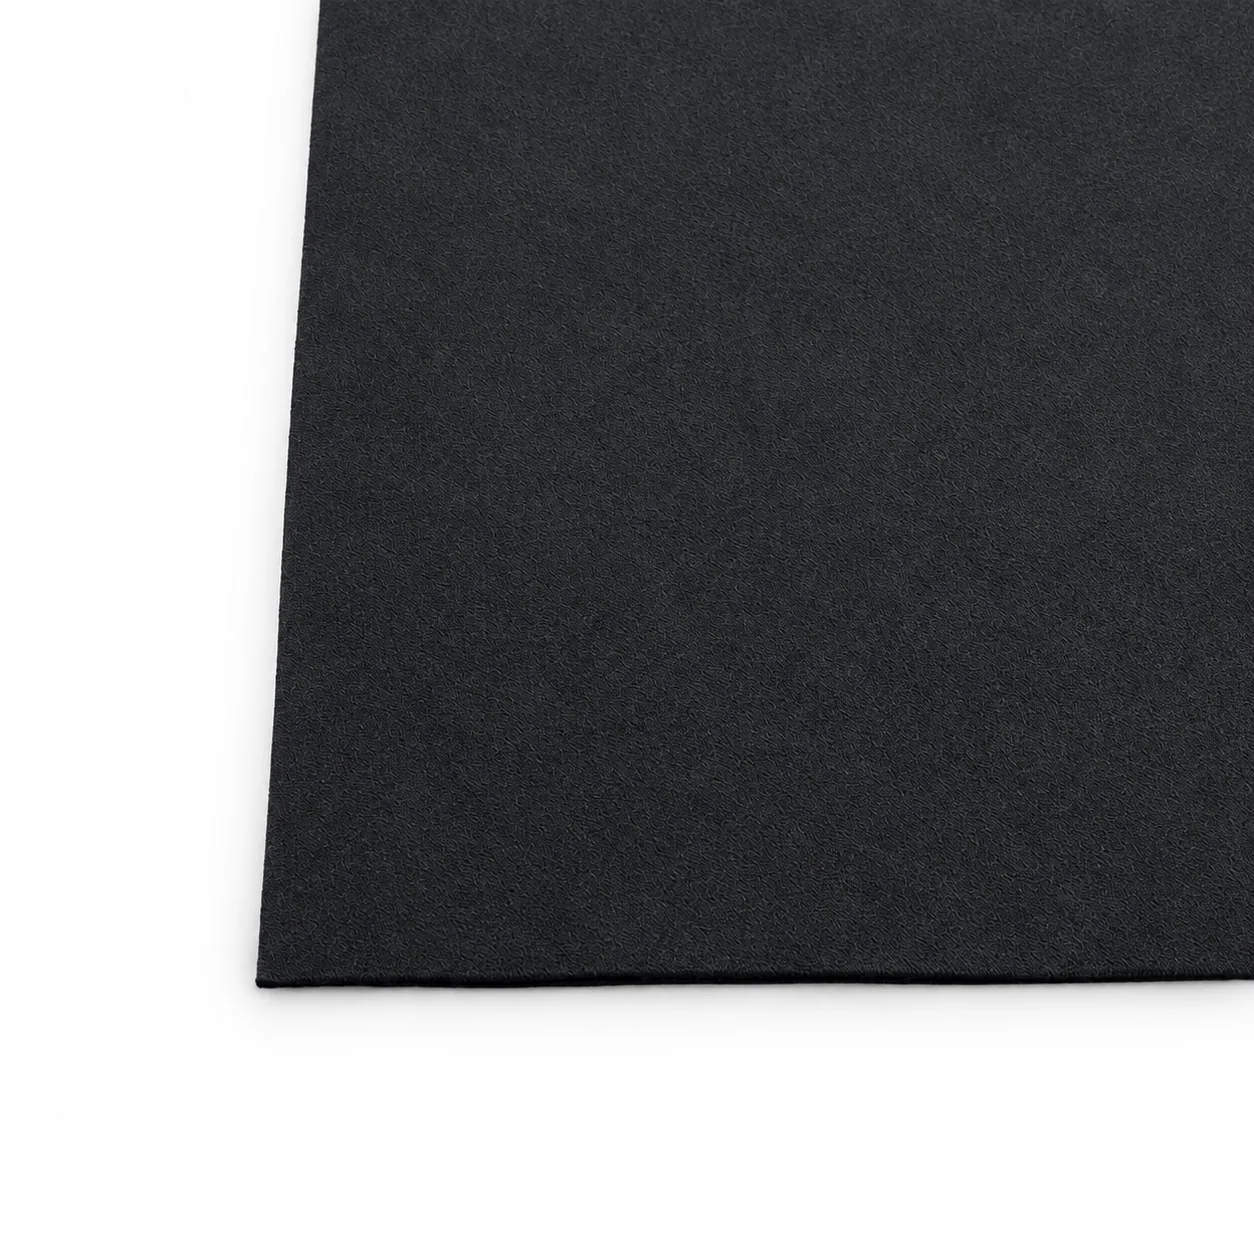
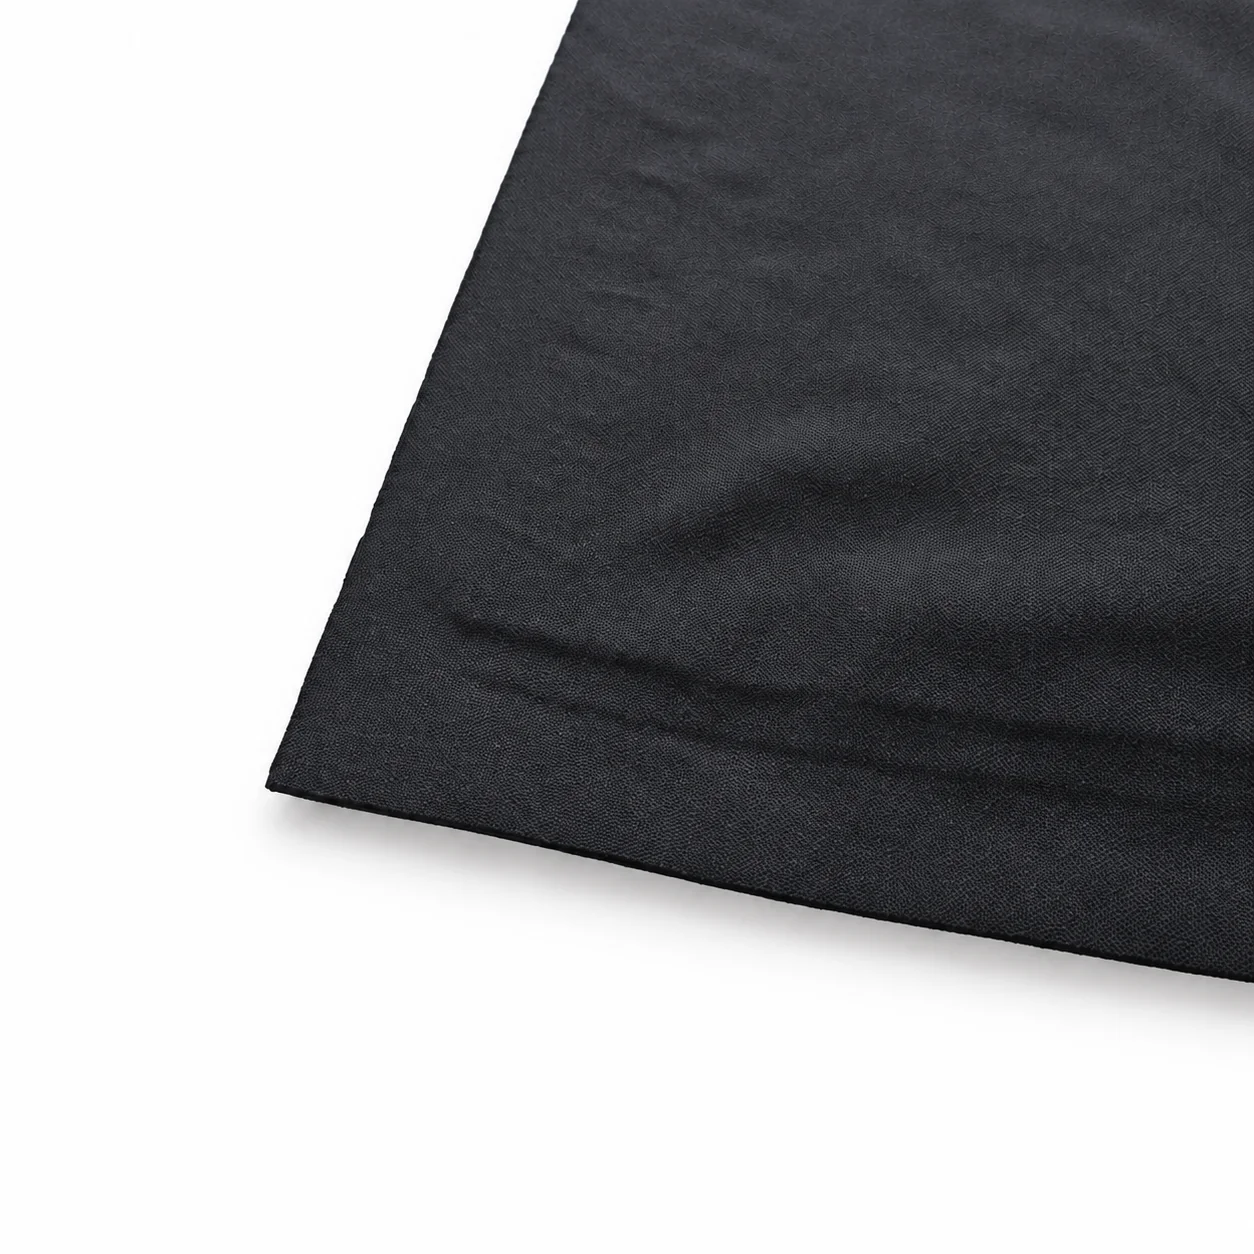
The Tactilus sensing element is available as a thin flexible mat. Its low-profile construction enables the sensor to adapt to curved surfaces and applications where introducing a thicker measuring device would be unsuitable.


